
Abstract
Objective
Head and neck squamous cell carcinoma (HNSCC) is a heterogeneous group of diseases characterized by high rates of recurrence and progression, and TNM staging alone is not always sufficient to predict prognosis. To facilitate individualized predict progression-free survival (PFS) prediction in patients treated with chemoradiotherapy (CRT), we developed a LASSO Cox model using routinely available pretreatment variables and created a nomogram to aid interpretation.
Material and Methods
We retrospectively reviewed 192 consecutive HNSCC patients treated with definitive or postoperative radiotherapy (RT)-based therapy at our center between December 2010 and October 2023. PFS was the primary endpoint of the study, and LASSO Cox penalized regression was applied for variable selection and coefficient shrinkage. The optimal lambda was determined using 5-fold cross-validation, and the Harrell C-index and receiver operating characteristic (ROC) curves were used to assess discriminatory performance. Calibration was also performed across risk quartiles. A Harrell-type nomogram was constructed.
Results
Among 192 patients, the observed PFS follow-up time was 20.3 months (median; interquartile range 10.0-43.9), and the median follow-up among censored patients was 26.5 months; 60 PFS events (31.3%) were recorded. LASSO Cox regression retained eight stable predictors in the model: Eastern Cooperative Oncology Group performance status [hazard ratio (HR): 1.33], age (HR: 1.24), tumor stage (HR: 1.17), neutrophil-to-lymphocyte ratio (HR: 1.16), C-reactive protein (HR: 1.16), lactate dehydrogenase (HR: 1.06), albumin (HR: 1.04), and body mass index category (a protective factor; HR: 0.65). The apparent C-index of the model was 0.666, which decreased to 0.591 after bootstrap optimism correction. In time-dependent ROC analysis, the area under the curve (AUC) reached its highest value at 24 months (AUC=0.72). High-risk patients (n=64) had a median PFS of 12.3 months and an event rate of 45.3%, whereas the low-to-intermediate-risk group (n=128) had a median PFS of 26.5 months and an event rate of 24.2% (p<0.0001).
Conclusion
The nomogram developed using the LASSO method and routine clinical and biochemical parameters significantly predicted PFS in patients with HNSCC treated with RT/CRT and identified distinct risk groups. By integrating five pathophysiological axes—demographic, functional, tumor burden, inflammatory, and nutritional—into a single tool, this model may provide practical support for clinical decision-making at the bedside; however, it requires confirmation through external, multicenter validation studies.
Keywords: Head and neck squamous cell carcinoma, progression-free survival, LASSO Cox regression, nomogram, prognostic model, radiotherapy
INTRODUCTION
With approximately 890,000 new cases annually, head and neck squamous cell carcinoma (HNSCC) is the seventh most common cancer worldwide and responsible for 400,000 deaths annually. Tumors of the oral cavity, pharynx, larynx, hypopharynx, and nasal cavity are included in this group, and the principal risk factors are smoking, alcohol consumption, human papilloma virus (HPV), and Epstein-Barr virus infections.,,, Radiotherapy (RT), administered concurrently with chemotherapy in both the adjuvant and definitive settings, is an important treatment modality for all stages and for patients with recurrent disease; however, the rates of recurrence and progression remain high.
Predicting treatment outcomes is critical to clinical decision-making. TNM staging in head and neck cancers is not always sufficient for determining prognosis and guiding treatment strategies; therefore, additional histopathological, inflammatory, nutritional, and biochemical markers/features that may better predict prognosis are being investigated.,,, Although many of these markers have been evaluated individually, multivariable predictive models integrating the patient’s functional status, systemic inflammatory response, and nutritional profile are also attracting increasing interest.
Systemic inflammation, nutritional status, biochemical markers, and performance status emerge as significant supplementary factors in the prognostication of head HNSCC. Elevated neutrophil-to-lymphocyte ratios (NLRs), hypoalbuminemia, low body mass index (BMI), and malnutrition are associated with poor survival outcomes; conversely, specific inflammatory indices and anthropometric measurements may indicate a more favorable prognosis.,,, Serum lactate dehydrogenase (LDH) levels and their fluctuations have been demonstrated to hold independent prognostic significance regarding survival., Because of its importance in treatment tolerability and administration, Eastern Cooperative Oncology Group (ECOG) performance status (PS) is one of the strongest clinical prognostic indicators of survival.
In view of these considerations, the development of integrated predictive models that concurrently evaluate diverse pathophysiological axes—including demographic, functional, tumoral, inflammatory, and nutritional factors—is of paramount clinical importance for estimating survival in HNSCC, moving beyond the analysis of individual prognostic markers. LASSO penalized Cox regression is increasingly utilized in oncological predictive modeling as a sophisticated statistical method that simultaneously performs variable selection and coefficient shrinkage within high-dimensional datasets.
The objective of this study was to predict progression-free survival (PFS) in patients with HNSCC treated with definitive or postoperative adjuvant RT, with or without concurrent chemotherapy, using a multivariate LASSO Cox regression model derived from routine clinical and laboratory parameters; to evaluate model performance through bootstrap and temporal validation; and to construct a Harrell-type nomogram suitable for clinical application.
MATERIAL AND METHODS
Study Population and Design
We retrospectively reviewed consecutive patients with histologically confirmed HNSCC who were treated with definitive or postoperative/adjuvant RT, with or without chemotherapy at a single oncology center between December 2010 and October 2023. Follow-up data were updated through May 22, 2024, and patients without progression or death were censored at their last documented follow-up on or before this date. Patients with missing survival data or zero follow-up duration were excluded. Before the initiation of the study, ethics committee approval, including a waiver of informed consent due to the retrospective design, was obtained.
Outcome Definition
The primary endpoint, which was PFS, was defined as the time from the start of treatment until disease progression or death from any cause. Patients who were alive without documented progression at the last follow-up were censored at that date.
Data Processing
Missing predictor data were handled using multiple imputation by chained equations (MICE), generating 20 imputed datasets. A LASSO-penalized Cox regression model was used for variable selection and coefficient shrinkage. In each imputed dataset, the optimal λ value was selected using 5-fold cross-validation based on Harrell’s C-index, and the λmin rule was applied. Stable predictors were identified according to their selection frequency across the imputed datasets, as detailed in the Supplementary Methods. Outcome variables were used only during imputation and were not included as predictors in the final prognostic model.
For the final model, a pooled prediction approach was used, whereby predicted survival probabilities were averaged across the 20 models fitted to the imputed datasets. Model performance was evaluated using the pooled apparent C-index, time-dependent receiver operating characteristic (ROC)-area under the curve (AUC) values, calibration plots, and the integrated Brier score. Internal validation was performed using bootstrap optimism correction (200 resamples) and temporal-split validation. Patients were stratified into risk groups according to the median and 67th percentile, and Kaplan-Meier curves were compared using the log-rank test. A Harrell-type nomogram was constructed to estimate 12-, 24-, and 36-month PFS. Detailed methodological procedures are provided in the Supplementary Methods.
RESULTS
Study Population
Of the 202 patients screened, 192 met the inclusion criteria and were analyzed. The median age was 58.4 years [interquartile range (IQR) 49.8-67.6], and 146 patients (76.0%) were male. Most patients had stage III-IVB disease (161/192, 83.9%); the American Joint Committee on Cancer (AJCC) stage distribution was stage I in 10 (5.2%), stage II in 21 (10.9%), stage III in 54 (28.1%), stage IVA in 80 (41.7%), and stage IVB in 27 (14.1%). One hundred and twenty-three patients (64.1%) received definitive concurrent chemoradiotherapy (CRT), while 69 (35.9%) received postoperative adjuvant RT or CRT after primary surgical resection. The ECOG PS was 0 in 37 patients (19.3%), 1 in 139 (72.4%), and ≥2 in 14 (7.3%). The baseline characteristics of the patients are shown in .
TABLE 1. Baseline demographic and clinical characteristics of the study population.
Characteristic | n (%) or median [IQR] |
|---|---|
Demographics | |
Age, years-median [IQR] | 58.4 [49.8-67.6] |
<60 years | 110 (57.3%) |
≥60 years | 82 (42.7%) |
Sex | |
Male | 146 (76.0%) |
Female | 46 (24.0%) |
Smoking status | |
Never | 47 (24.5%) |
Former | 73 (38.0%) |
Current | 69 (35.9%) |
Alcohol use | 35 (18.2%) |
Comorbidities | |
Diabetes mellitus | 21 (10.9%) |
Hypertension | 51 (26.6%) |
Coronary artery disease | 33 (17.2%) |
Tumor characteristics | |
Primary site | |
Larynx | 88 (45.8%) |
Hypopharynx | 13 (6.8%) |
Oropharynx | 42 (21.9%) |
Oral cavity | 42 (21.9%) |
Other | 7 (3.6%) |
T classification | |
T0-T1 | 18 (9.4%) |
T2 | 46 (24.0%) |
T3 | 61 (31.8%) |
T4 | 67 (34.9%) |
N classification | |
N0 | 67 (34.9%) |
N1 | 32 (16.7%) |
N2 | 61 (31.8%) |
N3 | 32 (16.7%) |
Clinical stage | |
I | 10 (5.2%) |
II | 21 (10.9%) |
III | 54 (28.1%) |
IVA | 80 (41.7%) |
IVB | 27 (14.1%) |
Treatment | |
ECOG performance status | |
0 | 37 (19.3%) |
1 | 139 (72.4%) |
≥2 | 14 (7.3%) |
Characteristic | n (%) or median [IQR] |
Treatment modality | |
Adjuvant CRT | 69 (35.9%) |
Definitive CRT | 123 (64.1%) |
Prior surgery | 74 (38.5%) |
Feeding gastrostomy | 18 (9.4%) |
RT dose, Gy-median [IQR] | 70.0 [66.0-70.0] |
Mucositis (any grade) | 127 (66.1%) |
Dysphagia (any grade) | 117 (60.9%) |
BMI category | |
Underweight | 17 (8.9%) |
Normal | 69 (35.9%) |
Overweight | 81 (42.2%) |
Laboratory values | |
NLR-median [IQR] | 2.6 [1.8-3.8] |
CRP, mg/L-median [IQR] | 8.4 [2.8-23.8] |
Albumin, g/L-median [IQR] | 41.7 [39.0-44.5] |
LDH, U/L-median [IQR] | 170 [148-190] |
Hemoglobin, g/dL-median [IQR] | 13.7 [12.5-14.6] |
Platelet count, ×10/µL-median [IQR] | 271 [221-327] |
Outcomes | |
PFS events (progression or death) | 60 (31.3%) |
Disease progression | 44 (22.9%) |
Death without progression | 16 (8.3%) |
Median PFS, months [IQR] | 20.3 [10.0-43.9] |
Median follow-up (censored), months | 26.5 |
Deaths (overall) | 35 (18.2%) |
Continuous variables are presented as median [IQR]; categorical variables as n (%). IQR: Interquartile range; ECOG: Eastern Cooperative Oncology Group; RT: Radiotherapy; CRT: Chemoradiotherapy; BMI: Body mass index; NLR: Neutrophil-to-lymphocyte ratio; CRP: C-reactive protein; LDH: Lactate dehydrogenase; PFS: Progression-free survival.
A total of 60 PFS events were recorded during follow-up [observed median PFS of 20.3 months (IQR 10.0-43.9)], comprising 44 disease progressions and 16 deaths without documented progression. The median follow-up among censored patients was 26.5 months. Among the nine candidate predictors, 59 values (3.4% of the predictor data matrix) were missing; CRP had the highest rate (28/192, 14.6%), followed by BMI category (25/192, 13.0%). No variable exceeded 15% missing data. Missing data in the dataset are presented in .
Variable Selection
LASSO Cox regression with λmin selection yielded a mean cross-validated C-index of 0.608 across the 20 imputed datasets (range 0.581-0.623). The final adaptive stability threshold was set above 70%, thereby retaining eight of the nine candidate predictors and excluding hemoglobin, which had a selection frequency of exactly 70%. Eight of nine candidate predictors achieved a selection frequency >70% and were therefore retained in the final model (; ). ECOG PS had the highest hazard ratio (HR: 1.33), followed by age (HR: 1.24), AJCC stage (HR: 1.17), NLR (HR: 1.16), and CRP (HR: 1.16), all reflecting recognized prognostic factors in HNSCC. LDH (HR: 1.06) was retained as a marker of tumor burden. Albumin was marginally retained, with a near-zero penalized coefficient (β=0.036; HR: 1.04), suggesting a limited independent prognostic contribution after adjustment for other nutritional and inflammatory markers in the model. A higher BMI category was the sole protective factor (HR: 0.65), which is consistent with the established obesity paradox in HNSCC. Hemoglobin was excluded by the adaptive stability threshold .
TABLE 2. LASSO Cox regression coefficients for the final PFS model.
Variable | Mean β | HR | Selection frequency |
|---|---|---|---|
ECOG PS | 0.287 | 1.33 | 100% |
Age (per SD) | 0.212 | 1.24 | 100% |
Tumor stage | 0.160 | 1.17 | 100% |
NLR (per SD) | 0.149 | 1.16 | 100% |
CRP (per SD) | 0.146 | 1.16 | 100% |
LDH (per SD) | 0.057 | 1.06 | 100% |
Albumin (per SD) | 0.036 | 1.04 | 95% |
BMI category | -0.427 | 0.65 | 100% |
Hemoglobin (per SD)* | 0.007 | 1.01 | 70% |
95% CIs are not directly available from penalized regression; bootstrap validation provides an alternative uncertainty estimate. *: Hemoglobin had a selection frequency of exactly 70%; the final adaptive stability threshold was raised above 70% to retain no more than eight predictors, thereby excluding hemoglobin. β: Penalized regression coefficient; HR: Hazard ratio; SD: Standard deviation; ECOG PS: Eastern Cooperative Oncology Group performance status; NLR: Neutrophil-to-lymphocyte ratio; CRP: C-reactive protein; LDH: Lactate dehydrogenase; BMI: Body mass index; CI: Confidence interval; PFS: Progression-free survival.
Model Discrimination
The apparent C-index, estimated using the pooled prediction approach across 20 imputed datasets, was 0.666. The bootstrap optimism correction (B=200) estimated a mean optimism of 0.075 (95th-percentile range -0.086 to 0.224), yielding an optimism-corrected C-index of 0.591 (). Time-dependent ROC analysis () demonstrated AUCs of 0.669 at 12 months, 0.720 at 24 months, and 0.696 at 36 months, with a mean AUC of 0.695 across the evaluation window. Discriminative performance was therefore strongest at the clinically critical 24-month landmark.
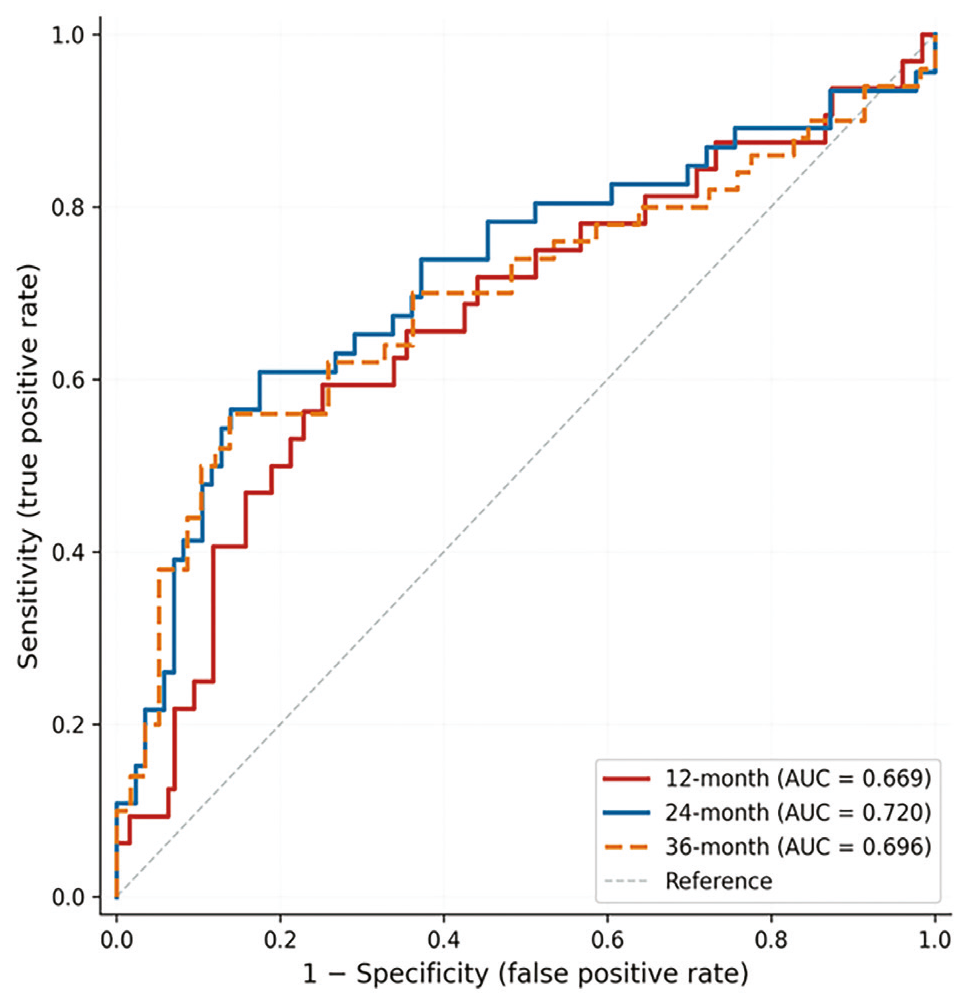
Time-dependent receiver operating characteristic curves at 12, 24, and 36 months. The diagonal dashed line represents random classification. AUC values are shown in the legend.
AUC: Area under the curve
Model Calibration
Calibration plots at 12, 24, and 36 months showed reasonable agreement between pooled predicted and Kaplan-Meier-observed PFS probabilities across the four risk quartiles (). The integrated Brier score was 0.172, indicating acceptable overall prediction accuracy ().
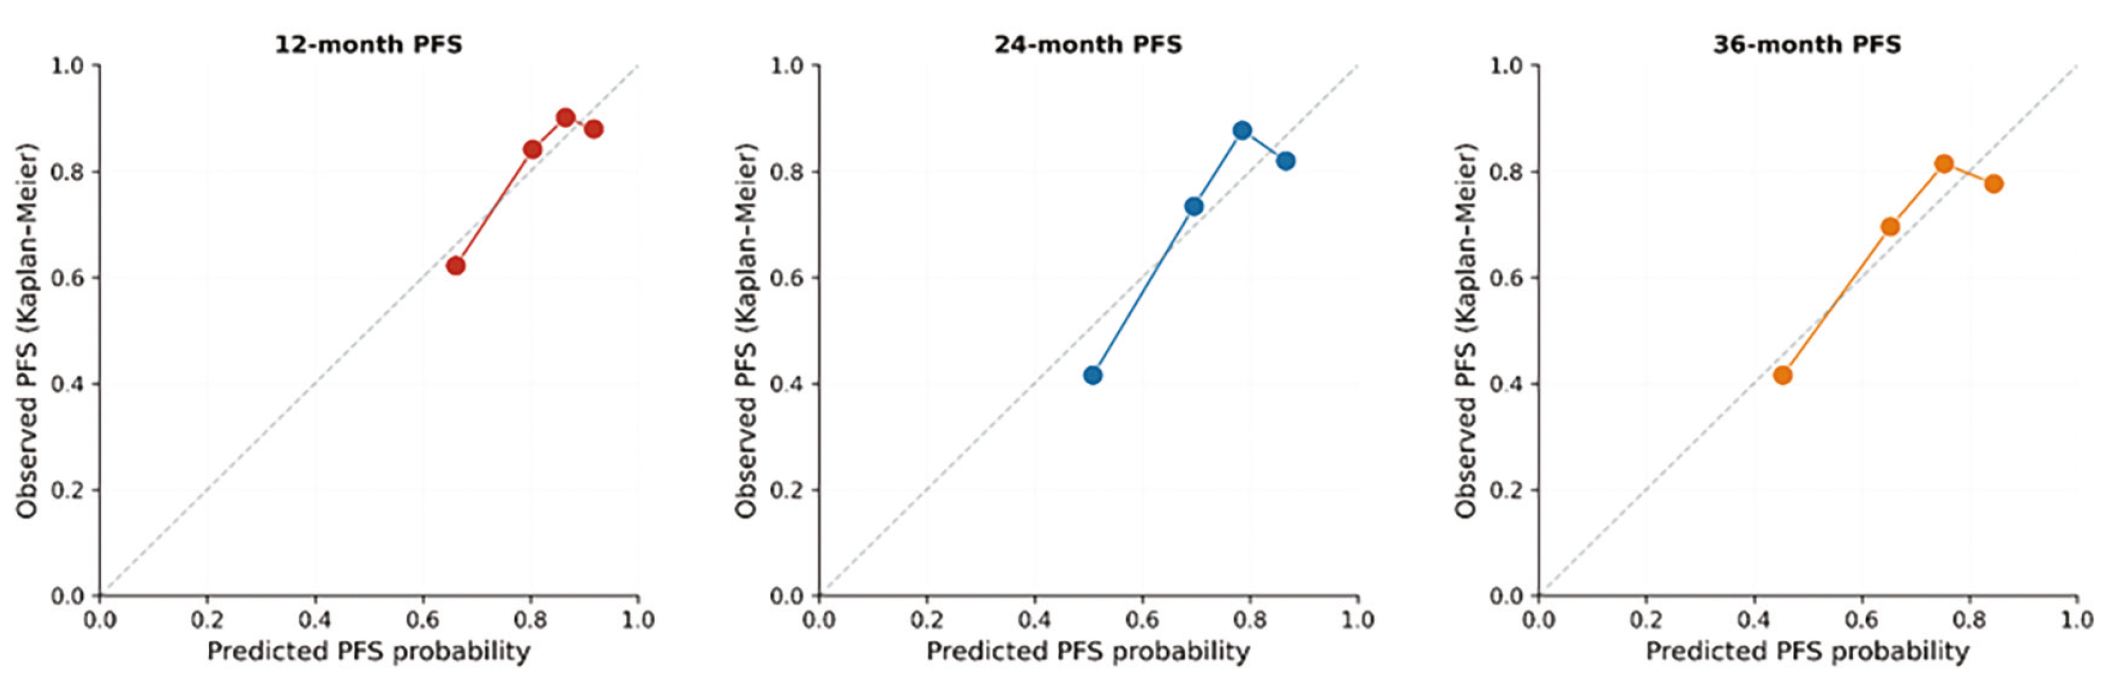
Calibration curves of the final PFS prediction model at 12, 24, and 36 months based on pooled predictions across 20 imputed datasets. Patients were divided into four risk groups. Circle size is proportional to group size. The diagonal dashed line represents perfect calibration.
PFS: Progression-free survival
Temporal Validation
Temporal split validation used the median diagnosis date (September 7, 2020) as the cut-point. The training set comprised 96 patients with 35 events, and the test set comprised 96 patients with 25 events. The C-index was 0.703 in the training set and 0.614 in the temporally independent test set (optimism=0.089), consistent with the bootstrap estimate of 0.075. As noted in Methods, variable selection was performed on the full cohort prior to the temporal split, so this analysis approximates rather than fully establishes external generalizability.
Risk Stratification
Using the median pooled nomogram score as an exploratory cut-point, Kaplan-Meier analysis demonstrated a significant separation in PFS between the high-risk and low-risk groups (log-rank p<0.0001; ). With the 67th-percentile exploratory cut-point (), high-risk patients (n=64) had 29 events (45.3%) and a median PFS of 12.3 months, whereas the low-moderate-risk group (n=128) had 31 events (24.2%) and a median PFS of 26.5 months (log-rank p<0.0001). The nomogram score thus identified a subgroup with nearly twice the event rate and approximately half the median PFS. Because both cut-points were chosen after inspection of the data, the log-rank p-values should be interpreted as descriptive, rather than confirmatory.
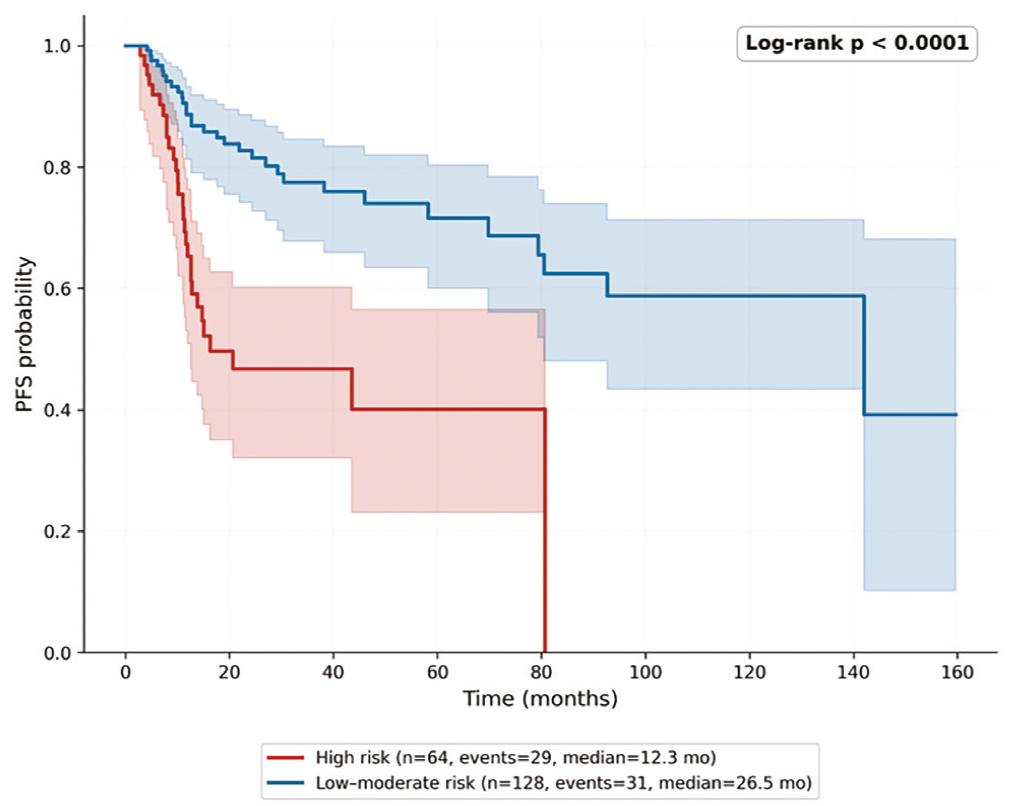
Kaplan-Meier PFS curves stratified by the 67th-percentile nomogram risk score. The high-risk group comprises the upper third of patients; the low-to-moderate-risk group comprises the remaining two-thirds. Shaded areas represent 95% confidence intervals. The p-value was calculated using the log-rank test.
PFS: Progression-free survival
Model performance metrics are summarized in .
Nomogram
A Harrell-type nomogram was constructed to translate the final model into a bedside-applicable scoring tool (). The eight predictors retained in the LASSO Cox model—ECOG PS, age, AJCC stage, NLR, CRP, LDH, albumin, and BMI category—are each mapped to a point value proportional to their penalized regression coefficients. Total points are converted into predicted PFS probabilities at 12, 24, and 36 months. As an illustrative example, a 70-year-old patient with ECOG PS 2, stage IVA disease, NLR of 5, CRP of 50 mg/L, LDH of 300 U/L, albumin of 35 g/L, and BMI category 1 (underweight) would accumulate a high total score corresponding to an estimated 12-month PFS of approximately 35-40%.
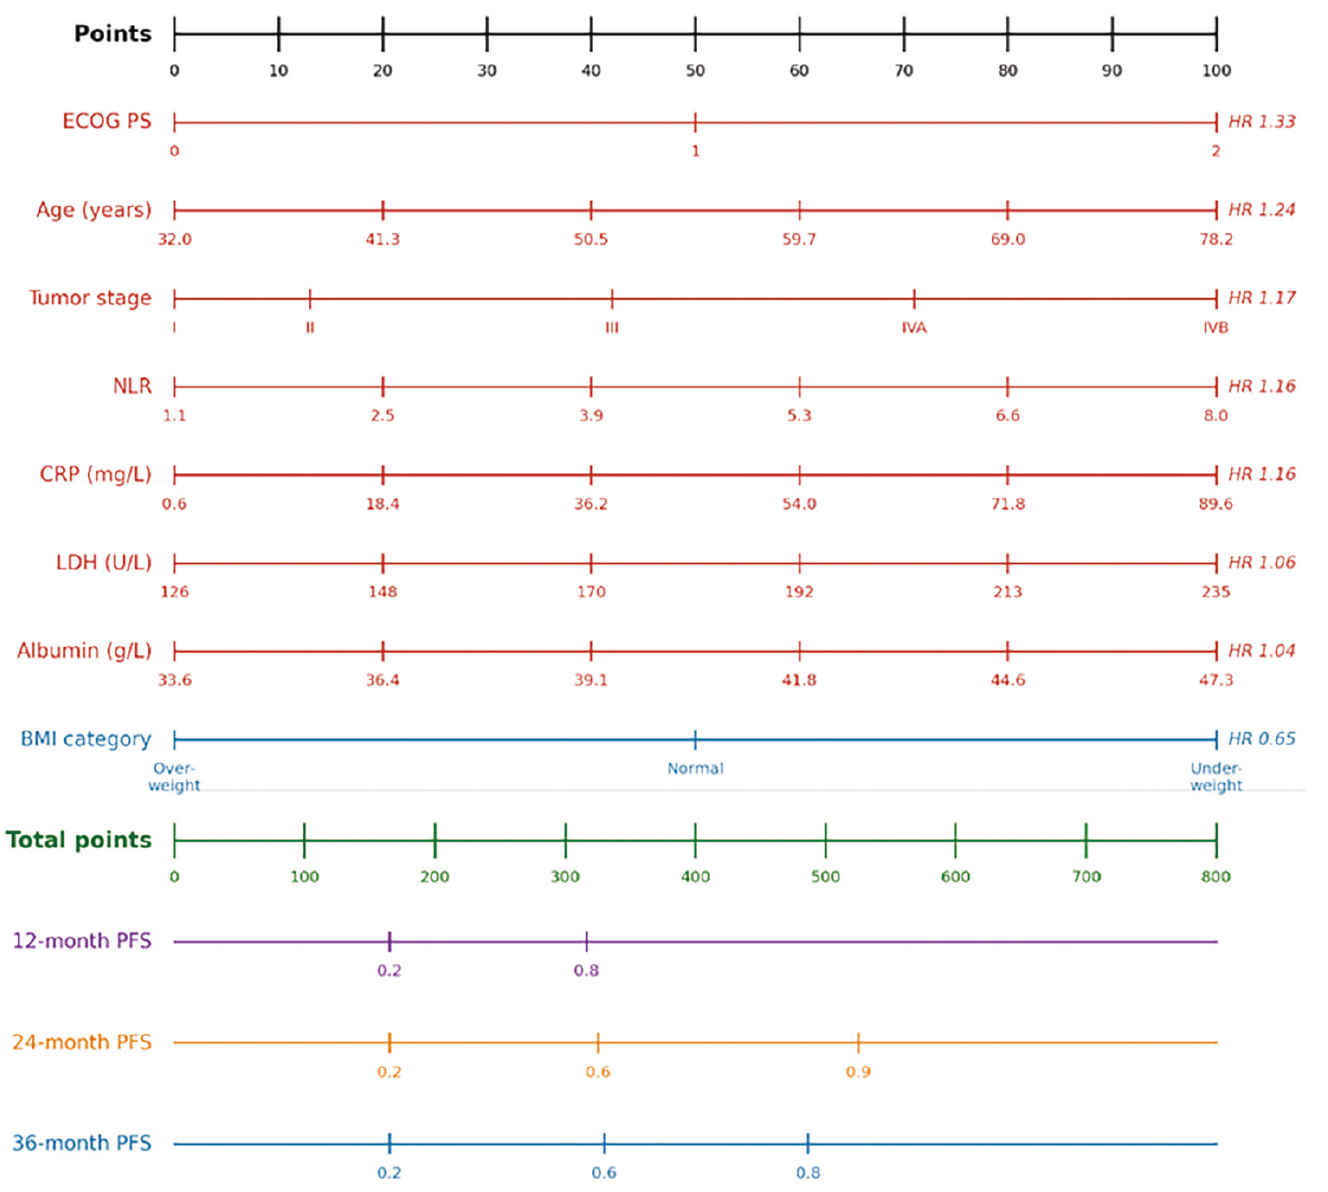
Nomogram for PFS prediction in head and neck squamous cell carcinoma. For each predictor, a vertical line is drawn to the points axis to determine the corresponding point value. All points are summed, and the total is used to read the predicted 12-, 24-, and 36-month PFS probabilities from the bottom axes.
PFS: Progression-free survival; HR: Hazard ratio; ECOG PS: Eastern Cooperative Oncology Group performance status; NLR: Neutrophil-to-lymphocyte ratio; CRP: C-reactive protein; LDH: Lactate dehydrogenase; BMI: Body mass index
DISCUSSION
This study aimed to retrospectively evaluate data from 192 patients with head and neck cancer, develop a LASSO Cox regression model to predict PFS in patients receiving CRT, and construct a nomogram to make this model more accessible. Comprising contributions from eight predictors, the model represents the demographic, functional, tumor burden, inflammatory, and nutritional axes, and demonstrates effective discriminative ability, achieving an AUC of 0.72 for 24-month PFS and a C-index of 0.66.
Age and Functional Status
The relationship between age and prognosis in patients with HNSCC has been extensively investigated; although the evidence has not been entirely consistent, meta-analyses have generally shown an association between older age and poorer overall survival (OS)., In our model, age also emerged as a risk factor. Advanced age may represent an adverse prognostic factor due to its association with treatment intolerance. Similarly, ECOG PS reflects the importance of functional capacity in the prognosis of HNSCC, and in our model it had the highest hazard ratio (HR: 1.33), consistent with the findings of Moon et al.’s prospective study. This may be explained by the fact that, in line with the literature, functional status is an integrated parameter reflecting the patient’s treatment tolerance, nutritional capacity, and overall physiological reserve.
Stage
Tumor stage was included in the model as an expected risk factor. Although the TNM staging system alone may be insufficient for predicting survival, it makes a meaningful contribution to model performance when evaluated together with other predictors. A meta-analysis including 40,808 patients with oral squamous cell carcinoma (SCC) found that risk increased progressively with advancing stage in the AJCC 8th edition staging system (stage II HR: 1.87, stage III HR: 2.65, stage IVa HR: 3.46, and stage IVb HR: 7.09).
Inflammatory Markers
Inflammatory markers that stood out in our model were CRP and NLR. As a reflection of the IL-6-mediated proinflammatory cytokine pathway, CRP has generally been associated with poor prognosis in real-world data, and in this respect, our model is consistent with the literature. Demonstrating that CRP, a frequently assessed and readily accessible biomarker, can be incorporated into a nomogram in a clinically usable manner may help determine prognosis and thus provide clinical benefit.
NLR, which may be regarded as a cellular biomarker reflecting the equilibrium between systemic inflammation and the antitumor immune response, was one of the inflammatory markers that were most prominent survival mediated immune response are linked to an elevated NLR through relative neutrophilia and/or lymphopenia. In fact, a high pretreatment NLR is linked to worse OS and disease-free survival (DFS)/PFS, according to meta-analyses done in HNSCC.
LDH
LDH, which may be considered a marker of tumor burden and turnover, made a modest contribution to the model; however, studies investigating its prognostic role in HNSCC have yielded heterogeneous results. Pan et al. showed that elevated pretreatment LDH was associated with worse OS, while Lee et al. demonstrated that early changes in LDH during treatment carried independent prognostic value for both PFS and OS. Nevertheless, results from surgical laryngeal cancer series have not been entirely consistent; Guo et al. found that elevated preoperative LDH was associated with better OS in patients with resected laryngeal SCC. Although the direction of LDH’s prognostic effect may vary by subsite and treatment context, LDH may still provide additional prognostic information related to tumor metabolism and hypoxia.
Nutritional Markers
Albumin, as a negative acute-phase reactant and a nutritional marker, has frequently been evaluated retrospectively in patients with HNSCC. Lim et al. reported in 338 patients with HNSCC that pretreatment albumin level was an independent predictor of DFS, cancer-specific survival, and OS, and that patients with low albumin had an approximately sixfold increased risk of progression and mortality. Yamagata et al. demonstrated a negative correlation between CRP and albumin in oral SCC concluded that the association between hypoalbuminemia and poor survival was secondary to the systemic inflammatory response. The modest contribution of albumin may be partly related to its overlap with other inflammatory markers, such as CRP and NLR, under the L1 penalization applied by LASSO.
The relationship between BMI and HNSCC has been established in the literature as risk-reducing and aligns with our model. Hobday et al.’s systematic review and meta-analysis showed that overweight HNSCC patients (BMI 25-30 kg/m) had a lower risk of death than normal-weight patients. On the other hand, underweight patients (BMI <18.5) had a much worse prognosis. Langius et al. showed, in a prospective cohort of 1,340 HNSCC patients, that pre-treatment weight loss of more than 10% remained associated with OS after adjustment for other factors. In the CRT subgroup, a weight loss exceeding 10% was correlated with disease-specific survival, exhibiting a hazard ratio of 3.3 (95% CI: 1.7-6.7; p=0.001). The emergence of increasing BMI as a protective factor in our model may be interpreted as a reflection of treatment intolerance following the disruption of nutritional dynamics in patients receiving CRT, and of the fact that patients experiencing pre-treatment weight loss undergo more severe cancer cachexia—and therefore as a manifestation of aggressive tumor biology.
Model Performance and Risk Stratification
Staging alone may be insufficient for prognostic stratification in head and neck cancer, a clinically heterogeneous group of malignancies arising from distinct anatomical subsites and pathogenetic mechanisms; accordingly, nomogram-based models may provide additional prognostic value. Our model, developed to predict PFS in patients with head and neck cancer treated with CRT, achieved an optimism-corrected C-index of 0.591, indicating clinically meaningful performance based on routine clinical parameters. In addition, the model reached an AUC of 0.72 at 24 months—the period during which recurrences occur most frequently—suggesting meaningful discriminative ability to predict early- to intermediate-term survival.
Temporal validation provided supportive, but not fully independent, evidence of the model’s generalizability because variable selection was performed on the entire cohort prior to the temporal split. The C-index values obtained in the training and test sets were 0.703 and 0.614, respectively, and closely aligned with the optimism estimated by bootstrap resampling (0.089 vs. 0.075). This consistency suggests that model performance was not confined to the development cohort alone but was reasonably generalizable to patients treated across different time periods. The preservation of performance in temporal validation is particularly noteworthy, as it indicates a limited tendency toward overfitting and supports the stability of the model’s prognostic information despite temporal variation.
Another notable finding was the model’s ability to discriminate between patients at low-intermediate risk and those at high risk. Using the 67th percentile as the cutoff, the upper one-third, defined as the high-risk group, was compared with the low-intermediate-risk group; median PFS was approximately halved (12.3 vs. 26.5 months). Although this exploratory stratification yielded a large effect size, the cut-point was data-driven, and the log-rank p-value should be interpreted as descriptive rather than confirmatory.
Study Limitations
The strengths of our study include the use of routinely available pretreatment parameters, the integration of five distinct pathophysiological axes, the management of missing data through multiple imputation, the application of both bootstrap and temporal validation methods, and the deliberate exclusion of treatment-related variables to minimize indication bias.
The limitations of our study can be summarized as follows. First, the retrospective, single-center design imposes limitations, including patient selection bias and limited generalizability. Second, the sample size, limited to 192 patients and 60 events, results in a borderline events-per-variable ratio (events per variable≈7.5), particularly for a model including eight predictors. Third, established prognostic factors such as HPV status could not be incorporated into the model because of missing data. Fourth, external validation could not be performed; therefore, the model’s performance in an independent cohort remains unknown.
CONCLUSION
Developed using routine clinical and laboratory parameters from patients undergoing definitive or postoperative adjuvant RT or CRT, this LASSO Cox-based nomogram demonstrated strong performance in predicting PFS in a patient group, such as those with head and neck cancer, which is characterized by heterogeneity, frequent recurrences, and in which prognostic determination is critical. By integrating diverse pathophysiological axes into a single tool, this model provides a practical approach that could enhance clinical risk stratification and treatment planning; nonetheless, validation in external cohorts is required.
Ethics
Ethics Committee Approval: The study was approved by the Ankara University Human Research Ethics Committee (approval no: i04-448-26, date: 21.04.2026).
Informed Consent: Owing to the retrospective design, the requirement for informed consent was waived.
Ethics Approval
The study was approved by the Ankara University Human Research Ethics Committee (approval no: i04-448-26, date: 21.04.2026). Owing to the retrospective design, the requirement for informed consent was waived. All procedures followed the principles of the Declaration of Helsinki.
Statistical Analysis
All analyses were performed in Python 3.10 using scikit-survival (LASSO Cox, C-index, time-dependent AUC, Brier score), lifelines (Kaplan-Meier curves, log-rank test), miceforest (MICE), and scikit-learn (StandardScaler, cross-validation). A two-sided α of 0.05 was used for all significance tests.
Footnotes
Authorship Contributions
Surgical and Medical Practices: M.K., Concept: M.K., H.A.Y., Design: M.K., Data Collection or Processing: M.K., H.B., E.E., Analysis or Interpretation: M.K., H.A.Y., Literature Search: M.K., Writing: M.K., H.B., E.E., H.A.Y.
Conflict of Interest
No conflict of interest was declared by the authors.
Financial Disclosure
The authors declared that this study received no financial support.
References
International Agency for Research on Cancer (IARC). Global cancer observatory [Internet]. Lyon: World Health Organization.
Wyss A, Hashibe M, Chuang SC, et al. Cigarette, cigar, and pipe smoking and the risk of head and neck cancers: pooled analysis in the International Head and Neck Cancer Epidemiology Consortium. Am J Epidemiol. 2013;178(5):679-690.
Blot WJ, McLaughlin JK, Winn DM, et al. Smoking and drinking in relation to oral and pharyngeal cancer. Cancer Res. 1988;48(11):3282-3287.
Hashibe M, Brennan P, Benhamou S, et al. Alcohol drinking in never users of tobacco, cigarette smoking in never drinkers, and the risk of head and neck cancer: pooled analysis in the International Head and Neck Cancer Epidemiology Consortium. J Natl Cancer Inst. 2007;99(10):777-789. Erratum in: J Natl Cancer Inst. 2008;100(3):225. Fernandez, Leticia [added].
Kobayashi I, Shima K, Saito I, et al. Prevalence of Epstein-Barr virus in oral squamous cell carcinoma. J Pathol. 1999;189(1):34-39.
Machiels JP, René Leemans C, Golusinski W, Grau C, Licitra L, Gregoire V; EHNS Executive Board; ESMO Guidelines Committee; ESTRO Executive Board. Squamous cell carcinoma of the oral cavity, larynx, oropharynx and hypopharynx: EHNS-ESMO-ESTRO Clinical Practice Guidelines for diagnosis, treatment and follow-up. Ann Oncol. 2020;31(11):1462-1475.
Dolens EDS, Dourado MR, Almangush A, et al. The impact of histopathological features on the prognosis of oral squamous cell carcinoma: a comprehensive review and meta-analysis. Front Oncol. 2021;11:784924.
Koh JH, Lim CYJ, Tan LTP, et al. Prevalence and association of sarcopenia with mortality in patients with head and neck cancer: a systematic review and meta-analysis. Ann Surg Oncol. 2024;31(9):6049-6064.
Yu Y, Wang H, Yan A, et al. Pretreatment neutrophil to lymphocyte ratio in determining the prognosis of head and neck cancer: a meta-analysis. BMC Cancer. 2018;18(1):383.
Qu H, Huang Y, Zhao S, Zhou Y, Lv W. Prognostic value of Epstein-Barr virus DNA level for nasopharyngeal carcinoma: a meta-analysis of 8128 cases. Eur Arch Otorhinolaryngol. 2020;277(1):9-18.
Woodley N, Rogers ADG, Turnbull K, et al. Prognostic scores in laryngeal cancer. Eur Arch Otorhinolaryngol. 2022;279(7):3705-3715.
Kim DY, Kim IS, Park SG, Kim H, Choi YJ, Seol YM. Prognostic value of posttreatment neutrophil-lymphocyte ratio in head and neck squamous cell carcinoma treated by chemoradiotherapy. Auris Nasus Larynx. 2017;44(2):199-204.
Moon H, Roh JL, Lee SW, et al. Prognostic value of nutritional and hematologic markers in head and neck squamous cell carcinoma treated by chemoradiotherapy. Radiother Oncol. 2016;118(2):330-334.
Sousa-Catita D, Ferreira-Santos C, Mascarenhas P, et al. Malnutrition, cancer stage and gastrostomy timing as markers of poor outcomes in gastrostomy-fed head and neck cancer patients. Nutrients. 2023;15(3):662.
Lee WH, Takenaka Y, Hosokawa K, et al. Changes in serum lactate dehydrogenase as a prognostic factor in patients with head and neck squamous cell carcinoma treated with immune checkpoint inhibitors. Acta Otolaryngol. 2024;144(5-6):398-403.
Guo E, Guo L, An C, et al. Prognostic significance of lactate dehydrogenase in patients undergoing surgical resection for laryngeal squamous cell carcinoma. Cancer Control. 2020;27(1):1073274820978795.
Sudha J, Julius A, Jimson S, Padmavathy K. Serum lactate dehydrogenase in the prognostic assessment of patients with oral squamous cell carcinoma. Indian J Dent Res. 2022;33(2):164-168.
Mohd Faizal NF, Shai S, Savaliya BP, et al. A narrative review of prognostic gene signatures in oral squamous cell carcinoma using LASSO Cox regression. Biomedicines. 2025;13(1):134.
Lee DS, Ramirez RJ, Lee JJ, et al. Survival of young versus old patients with oral cavity squamous cell carcinoma: a meta-analysis. Laryngoscope. 2021;131(6):1310-1319.
Kim DH, Kim SW, Han JS, Kim GJ, Basurrah MA, Hwang SH. The prognostic utilities of various risk factors for laryngeal squamous cell carcinoma: a systematic review and meta-analysis. Medicina (Kaunas). 2023;59(3):497.
Almangush A, Pirinen M, Youssef O, Mäkitie AA, Leivo I. Risk stratification in oral squamous cell carcinoma using staging of the eighth American Joint Committee on Cancer: systematic review and meta-analysis. Head Neck. 2020;42(10):3002-3017.
Aarstad HH, Moe SEE, Bruserud Ø, Lybak S, Aarstad HJ, Tvedt THA. The acute phase reaction and its prognostic impact in patients with head and neck squamous cell carcinoma: single biomarkers including C-reactive protein versus biomarker profiles. Biomedicines. 2020;8(10):418.
Chen Y, Cong R, Ji C, Ruan W. The prognostic role of C-reactive protein in patients with head and neck squamous cell carcinoma: a meta-analysis. Cancer Med. 2020;9(24):9541-9553.
Tham T, Bardash Y, Herman SW, Costantino PD. Neutrophil-to-lymphocyte ratio as a prognostic indicator in head and neck cancer: a systematic review and meta-analysis. Head Neck. 2018;40(11):2546-2557.
Pan C, Wu QV, Voutsinas J, et al. Peripheral lymphocytes and lactate dehydrogenase correlate with response and survival in head and neck cancers treated with immune checkpoint inhibitors. Cancer Med. 2023;12(8):9384-9391.
Lim WS, Roh JL, Kim SB, Choi SH, Nam SY, Kim SY. Pretreatment albumin level predicts survival in head and neck squamous cell carcinoma. Laryngoscope. 2017;127(12):E437-E442.
Yamagata K, Fukuzawa S, Ishibashi-Kanno N, Uchida F, Bukawa H. Association between the C-reactive protein/albumin ratio and prognosis in patients with oral squamous cell carcinoma. Sci Rep. 2021;11(1):5446.
Hobday S, Armache M, Paquin R, et al. The body mass index paradox in head and neck cancer: a systematic review and meta-analysis. Nutr Cancer. 2023;75(1):48-60.
Langius JA, Bakker S, Rietveld DH, et al. Critical weight loss is a major prognostic indicator for disease-specific survival in patients with head and neck cancer receiving radiotherapy. Br J Cancer. 2013;109(5):1093-1099.
Ghadjar P, Hayoz S, Zimmermann F, et al.; Swiss Group for Clinical Cancer Research (SAKK). Impact of weight loss on survival after chemoradiation for locally advanced head and neck cancer: secondary results of a randomized phase III trial (SAKK 10/94). Radiat Oncol. 2015;10:21.